 A brand new home awaits its new residents…
Based on newly-released income data from the 2016 Census, high poverty rates continue to plague Richmond thanks to suspiciously low reported levels of income.
“Good grief,” exclaimed urban planner and director of Simon Fraser University City Program Andy Yan, when he viewed region-wide data that showed Richmond at the bottom.
Richmond’s poverty rate (living with low after-tax income based on average household needs) is 22.4 per cent, while Metro Vancouver is at 16.5 per cent and Canada’s rate is 14.2 per cent. Its child poverty rate is 25.6 per cent, higher than any other metropolitan area (not including specific cities) in Canada.
Not to dismiss very real poverty that exists in Richmond, Yan said the figures are likely skewed due to underreporting of income.
While reported incomes in Richmond have grown above the regional, provincial and national rates over the past decade, according to the 2016 Census, they still remain well below average across all accounts, leaving many, once again, scratching their heads, considering the city’s wildly absurd housing prices.
Richmond’s median total household income is $65,241, whereas the region’s is $72,662. Canada’s household income sits at $70,336. Since 2005, Richmond’s household income has risen 15.9 per cent, from $56,285. The regional growth rate was 12.2 per cent while across Canada, incomes increased 10.8 per cent.
When asked about the performance of the city’s local economy, Coun. Derek Dang, who sits on council’s economic advisory board, said he believes it to be strong.
“No, I don’t believe the economy is bad. We definitely have successful businesses,” concluded Dang.
But, “I’m not sure [income] reporting on the Census accurately displays what we’re doing,” said Dang, who hypothesized whether well-paying businesses outgrow the city or if the city has too many low-paying service jobs, such as at the airport.
And so, “Maybe, in the back of my mind, maybe people aren’t declaring their income,” he said.
It’s a hypothesis floated recently by real estate analyst Richard Wozny, of Site Economics, who told the Vancouver Sun last week the census data highlights “inappropriate reporting of family incomes,” leaving one to wonder if “Canada has become a freeloader society.”
Speaking to the Richmond News last month, Wozny outlined in his report Low Incomes and High House Prices in Metro Vancouver how Richmond’s incomes are entirely out of touch with housing costs.
“Richmond and Vancouver now have amongst the highest income-to-house price ratios in the world and such an anomaly should trigger a closer look at factors that underlie this disparity.
“It is important to note that a ratio of five is considered overpriced and our region is over 20. Burnaby is 23, Richmond is 28 and neither is dominated by renters or seniors,” wrote Wozny, adding that all cities have relatively the same ratio of empty-nester, pensioning boomers — a factor that pulls income rates down (although the ratio of Richmond’s seniors is growing disproportionately).
Yan described the income reporting in Richmond as “weird.”
“For the most part, you see [low incomes] in the Downtown Eastside. But then you also see what’s happening in Burnaby and Coquitlam . . . And then comes Richmond. It really is that section on No. 3 Road, that’s just weird,” said Yan.
Yan suggests the combination of poorly-paying jobs and the influx of foreign money is, in part, a culprit of the income-housing price disconnect.
Noting residents must declare global income, Yan said underreported incomes is the likely reason Richmond is so low.
Yan said growth in residential real estate is disconnected from income growth. Low interest rates (“cheap money”) play a role but they’re found across the country where there is no disconnect.
“How much of it is poor paying jobs vs this issue of underreported incomes?” asked Yan.
Local factors such as wealth immigration and land constraints should be part of the conversation.
“It’s more a series of multiple compounding factors,” he said.
That said, “When it comes to university grads who are between [age] 25-64, Metro Vancouver incomes are the lowest and yet our housing costs are some of the highest. It says something to populations that have access to global wealth,” said Yan.
Richmond and Vancouver’s Point Grey have the highest rates of investor-class immigrants, according to a UBC study. It also has the fewest Syrian refugees per capita in B.C. (four out of 1,938 B.C.-settled Syrians settled in Richmond, to September 2016). Federal data shows after 10 years, the former will pay less income tax than the latter.
When asked why Richmond’s reported incomes are so low and whether it is reflective of a poor local economy, Mayor Malcolm Brodie chalked the figures up to Richmond having lots of co-op and social housing (largely built in the 1970s and ‘80s). Like Dang, he contended the economy is strong.
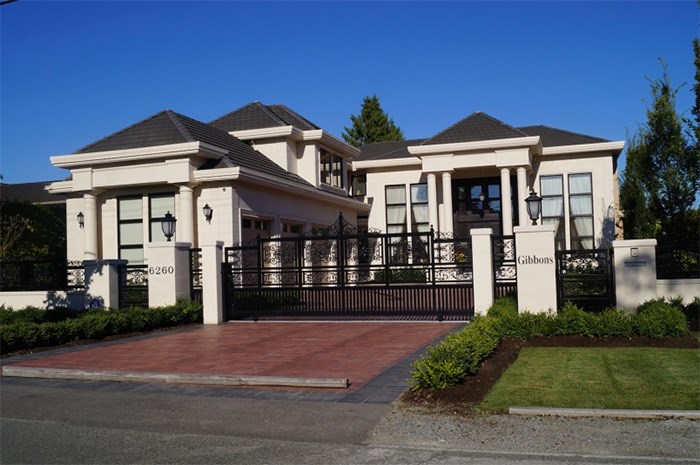
In 2015, Richmond reported a record $1 billion in development permits. In the Thompson neighbourhood, where median reported incomes in some census tracts (small areas) are even below the city’s median, new houses are being routinely being sold for over $3 million and some are sold for over $6 million. The city will soon be home to luxury car condos in east Richmond.
Read more from the Richmond News