Today, health officials announced the deadliest weekend in B.C.'s coronavirus (COVID-19) history, with a staggering 46 fatalities in three days.
Provincial health officer Dr. Bonnie Henry became emotional Monday as she expressed her condolences to families and thanked caregivers for their dedication.
Henry said 80 per cent of the deaths were in long-term care homes, and 441 people have now died of COVID-19 in the province. She added that the rise in deaths reflects the challenge of dealing with the virus in communities, and the impact on seniors when it gets into care homes.
“This has been a challenging pandemic for all of us, with so many of the usual ways that we connect with those we care about – our families, friends and communities – paused or significantly changed as a result of COVID-19," she explained.
“For the many occasions and daily life activities that we would normally do together, we must stay apart. And despite how difficult this may be, most people in B.C. are doing the right thing."
There are outbreaks in 57 long-term care and assisted living facilities as well as in five in acute-care units in British Columbia.
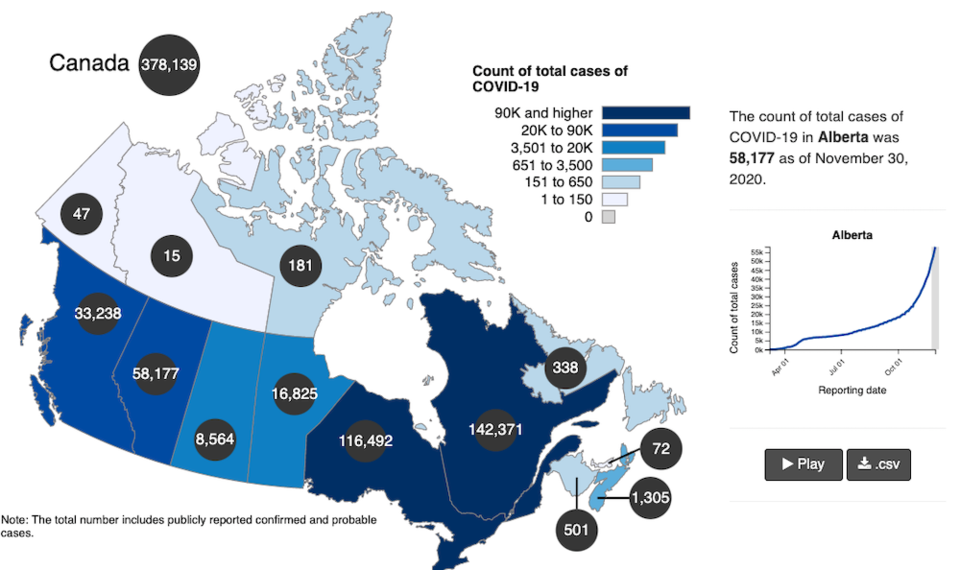
Interactive Coronavirus (COVID-19) Outbreak Map of Canada
Last week, Vancouver Is Awesome shared information regarding the per capita rate of active COVID-19 cases in B.C. and across Canada. According to the data, the province continues to see a higher per capita rate of active cases than the country's two most populous provinces, Ontario and Quebec.
Since Friday, B.C.'s per capita rate of active cases has climbed from 181 to 191 per 100,000 people. However, it still isn't anywhere near as high as Quebec (676), Alberta (376), Saskatchewan (330) and Nunavut (278).
B.C.'s per capita death rate has also increased from 8 to 9 per 100,000 people. In contrast, Quebec has 83 deaths per 100,000 people.
When it comes to total cases of the virus, Ontario has seen a staggering 116,492 and Quebec has seen 142,371. B.C. has seen a fraction of those figures, with 33,238 cases.
The interactive map also allowed you to see the total number of people tested per one million, as well as the number of people who have recovered.
Simply hover over provinces and territories to see total cases, active cases, or deaths in Canada over time. Click the play button to animate the map and see the evolution of the pandemic Canada-wide since March.
You can view the federal government's interactive outbreak map for more information here.
--With files from the Canadian Press.


