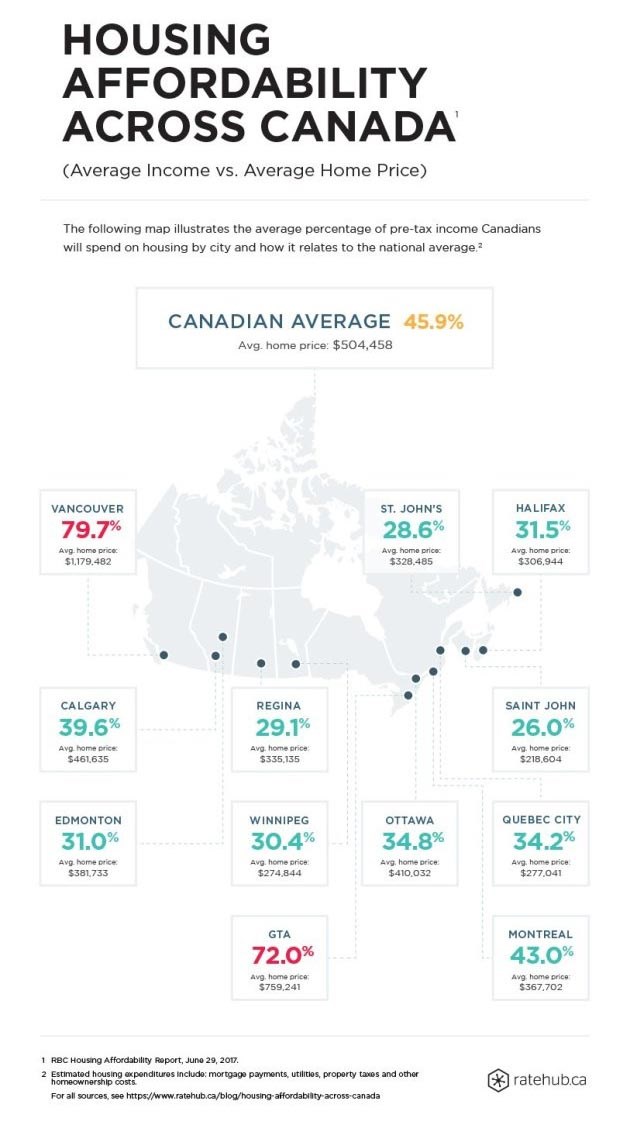
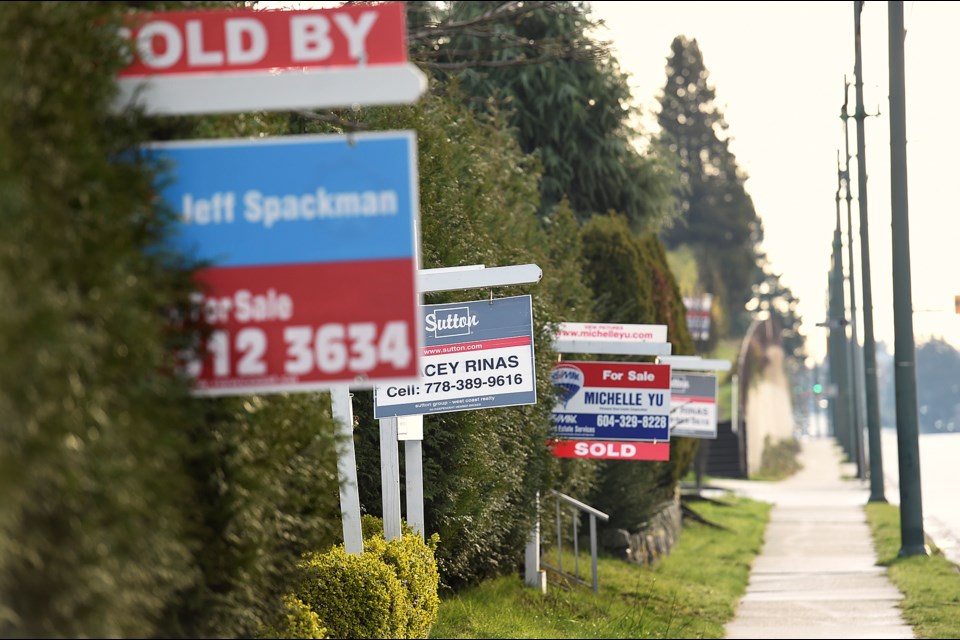
The costs of homeownership in Vancouver can total as much as 79 per cent of typical household income, according to the latest RBC Affordability Index – far greater than the 30 per cent maximum recommended by Canada Mortgage and Housing Corporation.
Using the Index, Ratehub created a housing affordability map for major cities across Canada, and calculated the national average. The map was created by examining utilities, mortgage payments and property taxes in each major city to calculate the percentage of pre-tax income Canadians are spending on housing.
Not surprisingly, residents of Vancouver and the GTA took to the top two spots, with home ownership costs making up 79.7 per cent and 72 per cent of incomes respectively. Both cities rank more than 20 per cent higher than the national average calculated by RateHub of 45.9 per cent.
RateHub co-founder James Laird explained that other factors must be considered when examining affordability in the Toronto and Vancouver housing markets.
"People buying in these geographies cannot only be relying on their income to pay for these homes," Laird said. "Many of them are relying on existing wealth that was not earned in the most recent tax year."
Of the 12 cities examined in the report, Regina, Saskatchewan, St. John, New Brunswick and St. John's, Nova Scotia were the only three in which home ownership costs made up under 30 per cent of typical incomes.


