We all know that real estate prices in Metro Vancouver have gone nuts over the past decade or so, but how does that growth compare with other North American cities?
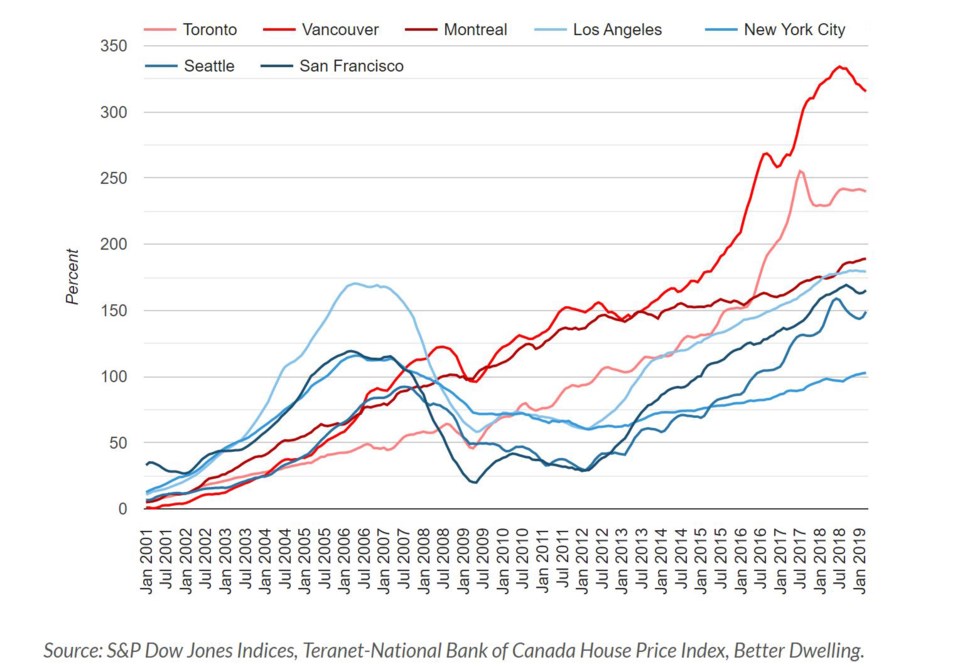
Canadian housing blog Better Dwelling crunched the numbers and came up with a jaw-dropping graph that shows just how dramatically prices have risen in the region since 2000, as compared with cities such as New York, San Francisco, Los Angeles, Toronto and Montreal.
It found that Metro Vancouver home prices have risen a whopping 316 per cent since January 2000, which is more than a four-fold increase.
In comparison, New York home prices have increased by just under 103 per cent, which is only just over double what they were in January 2000. The other North American cities studied range between the two, with Toronto seeing the continent’s second-steepest growth, up 240 per cent, in that 19-year period.
Check out the price-growth graph below, or see the original article for the interactive chart that reveals price growth over January 2000 at every month for each North American city.


